
Monday, March 31, 2014
Topographic map on google earth
I chose to do a topographic map of stone mountain. I opened google maps and searched the area. Then I selected the add path option and clicked carefully for each path at an elevation. I made paths from 900 ft to 1400 ft. Different colors were utilized to differentiate between the elevations. Here is my topographic map!

Maps and Cartography
There are 4 types of maps I am going to discuss: chloropleths, dot density maps, proportional symbol maps, and isarithmic maps. Each type of may displays information in a different way.
Here is an example of a chloropleth. Chloropleths give different regions a color thats affiliated with some type of data. one of the most common examples of this is showing which states voted for a certain presidential candidate during the election.


Here is an example of a chloropleth. Chloropleths give different regions a color thats affiliated with some type of data. one of the most common examples of this is showing which states voted for a certain presidential candidate during the election.
A dot density map is exactly what it sounds like. A dot is placed on the map for each incident for some type of data. A common example is a population dot density map, where each dot represents an allotted number of people.
Proportional symbol maps provide an visual representation of the magnitude of a statistic for a region. The larger the symbol, the larger the number.

Lastly, an isarithmic map shows how a certain type of data varies over a region. It is displayed by change in color and its shape is not limited by the political lines drawn on maps.

Saturday, March 15, 2014
Geology
There are 3 types of rock: igneous, metamorphic and sedimentary. Igneous rocks are formed from volcanic activity. Metamorphic rocks are formed from high heat and pressure when deep in the earth's crust. Lastly, sedimentary rocks are formed from layers of soil piling up and compressing. that These comprise all the rocks we see on a daily basis. An example of each will be discussed below.
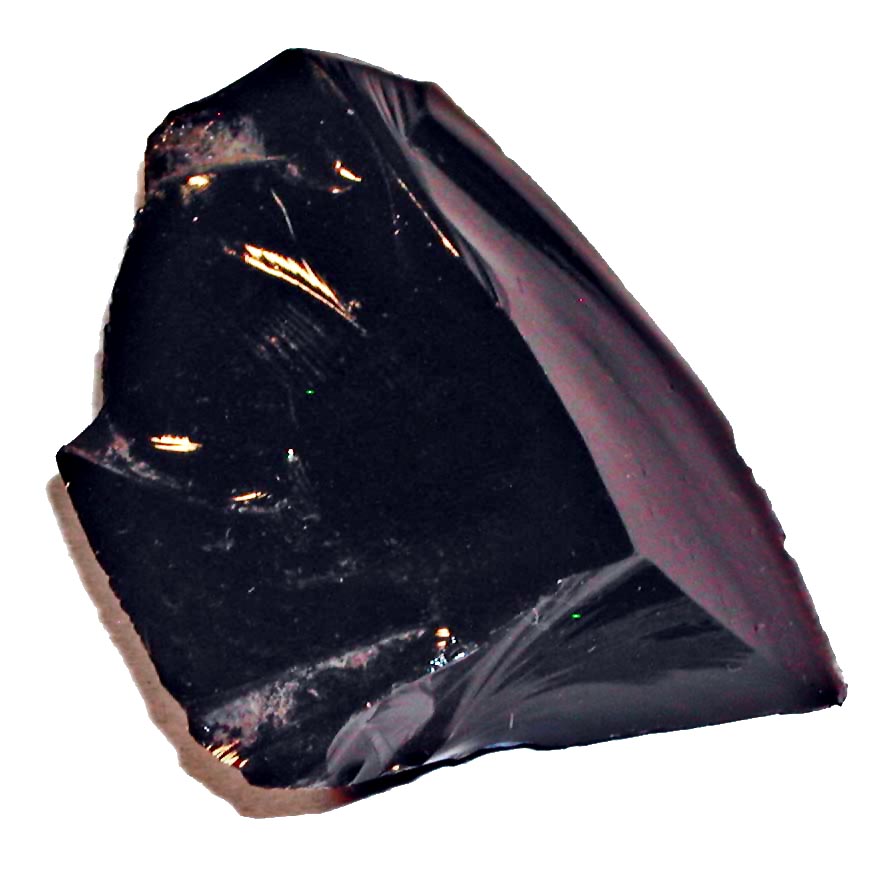
Type: igneous
name: obsidian
Description: a glass like igneous rock that is high in silica content. It is a very dark black color and is produced from felsic lava.
Type: metamorphic
name: phyllite
description: produced from slate that is further pressurized and heated. the main components are quartz, chlorite, and sericite mica. It is a fairly foliated rock.

Type: sedimentary
name: sandstone
description: typically composed of quartz and/or feldspar. A very grainy rock due it composition of compressed sand. colors vary depending on the type of sand the rock is made from.

All the information provided above was gathered from wikipedia.
http://en.wikipedia.org/wiki/Obsidian
http://en.wikipedia.org/wiki/Phyllite
http://en.wikipedia.org/wiki/Sandstone
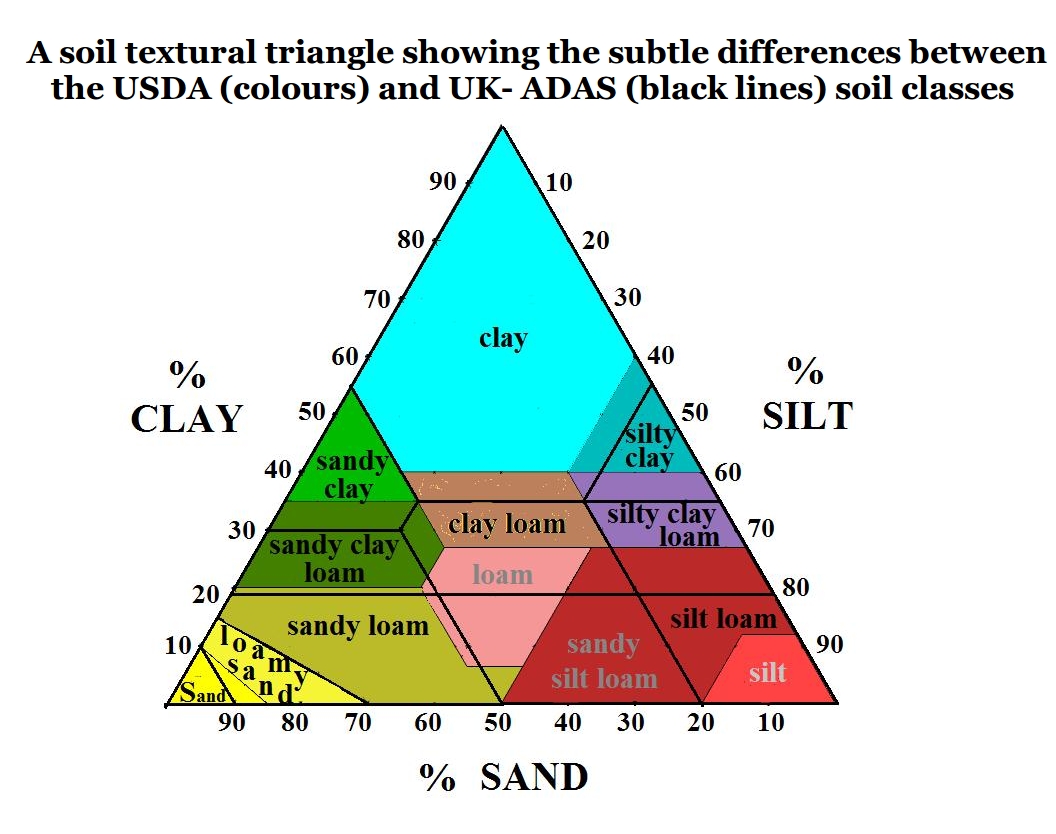
Another topic to be discussed is the variation in soil through out the world. the type of soil in an area can usually be affiliated with the typical weather pattern for the area. There are 12 different soil orders that are labeled through out the Earth. These soil types are determined by the amount of composition of sand, clay, and silt in the soil. Varying the amounts of each produce different typers of soil. for the visual heuristic involved and in-depth analysis of the soil types, refer to the picture and link below.
Soil Orders:
http://www.nrcs.usda.gov/wps/portal/nrcs/detail/soils/edu/?cid=nrcs142p2_053588
soil triangle
Sunflower
The sunflower did sprout when I planted it two days after the class the seeds were handed out. The plant has steadily grown since and has not wilted significantly once(so far).


Here is the first picture taken on February 18. This is right after the plant had sprouted.
This was taken 2 days later on February 20th. The plant was 2.5 inches tall. From this point on the plant was constantly rotated to avoid bending too much to one side, since it grew towards the sunlight like all plants do.
Here is the most recent picture. a pin had to be placed in the soil so it would grow up rather than out. It is about a foot tall now and has survived spring break with out me.
Homemade barometer
This lab used household items to create a barometer. The
homemade barometer consisted of the following materials: a balloon, a small
glass bowl, a small piece of tape and a straw. The balloon was cut in half ant
stretched over the top of the bowl. Then the straw is taped in the center of
the balloon membrane. Periodically the height of the tip of the straw was
measured and recorded with the affiliated pressure published by the weather
channel.

The barometer was very simple to construct, even though
stretching the balloon was rather annoying. The calibration process required
the use of excel to calculate a trend line. This lab showed how easy it is to
make a homemade barometer, and showed what steps were necessary to calibrate
it. Plotting the data gave me with a better understanding of excel and how to
properly format the tables and graphs. The additional exposure to excel should
help me present technical findings in a more professional manner.


Monday, February 17, 2014
Wind rose plots for Atlanta airport

Here are the airport's wind rose plots from 1992 for the four seasons. The plots show which way the wind is going, not where the winds are coming from. One of the major concerns in Macon is air pollution. While Macon produces pollution on its own, part of the pollution seen in our area is pushed down from Atlanta. As you can clearly see in the spring wind rose plot, air movement can tend heavily south, which would move Atlanta's heavy air pollution into the Macon area. The wind rose plots vary drastically from season to season and show how the seasons influence weather patterns.
Sunday, February 9, 2014
Sun Position and Seasonality


|
Time
|
Horizontal angle
|
Vertical angle
|
|
9 am
|
325
|
15
|
|
11 am
|
310
|
32
|
|
1 pm
|
280
|
39
|
|
3 pm
|
250
|
30
|
|
4 pm
|
230
|
23
|
Subscribe to:
Posts (Atom)