There are 3 types of rock: igneous, metamorphic and sedimentary. Igneous rocks are formed from volcanic activity. Metamorphic rocks are formed from high heat and pressure when deep in the earth's crust. Lastly, sedimentary rocks are formed from layers of soil piling up and compressing. that These comprise all the rocks we see on a daily basis. An example of each will be discussed below.
Type: igneous
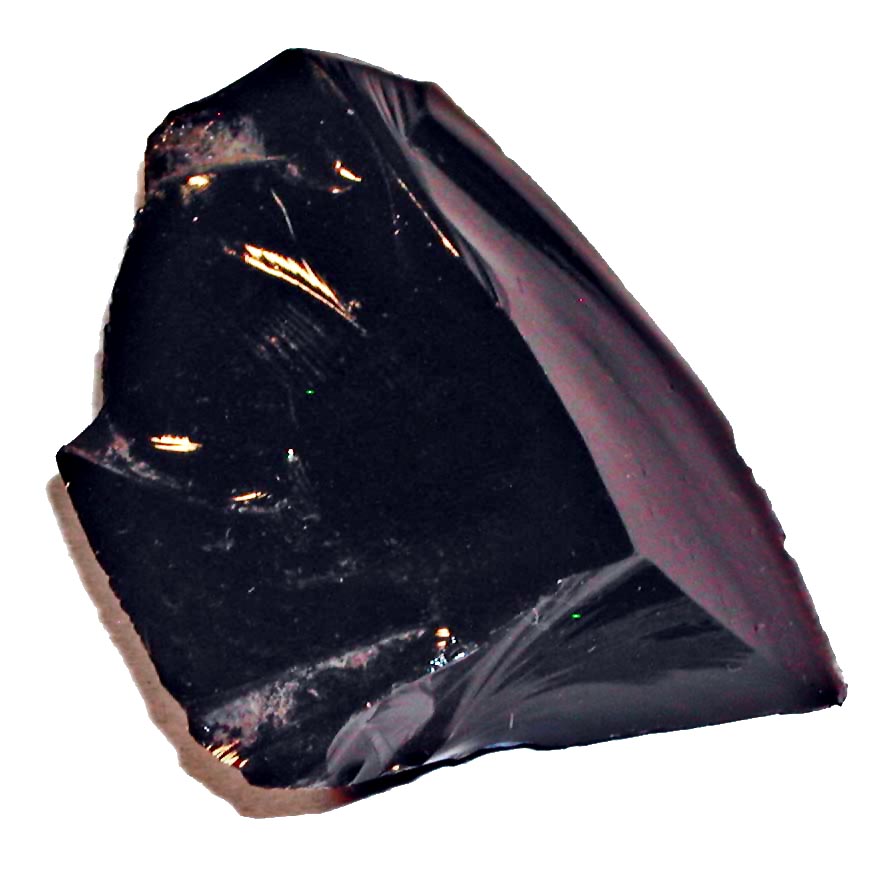
name: obsidian
Description: a glass like igneous rock that is high in silica content. It is a very dark black color and is produced from felsic lava.
Type: metamorphic
name: phyllite
description: produced from slate that is further pressurized and heated. the main components are quartz, chlorite, and sericite mica. It is a fairly foliated rock.
Type: sedimentary
name: sandstone
description: typically composed of quartz and/or feldspar. A very grainy rock due it composition of compressed sand. colors vary depending on the type of sand the rock is made from.
All the information provided above was gathered from wikipedia.
http://en.wikipedia.org/wiki/Obsidian
http://en.wikipedia.org/wiki/Phyllite
http://en.wikipedia.org/wiki/Sandstone
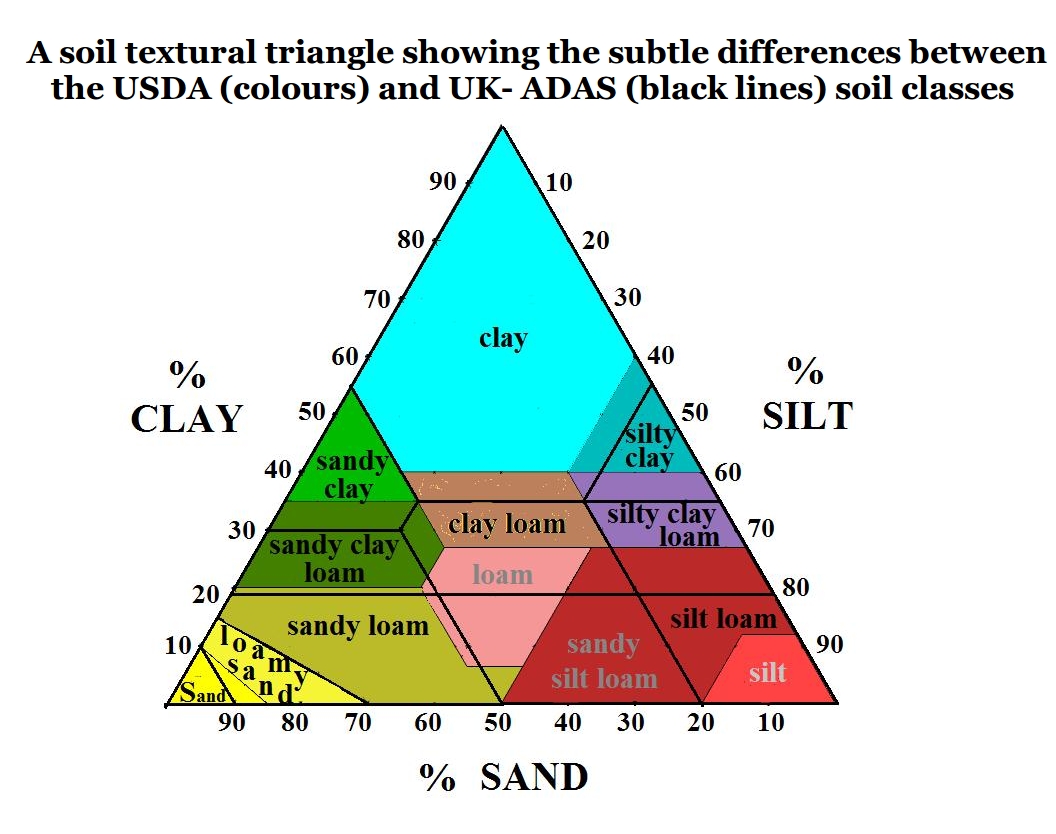
Another topic to be discussed is the variation in soil through out the world. the type of soil in an area can usually be affiliated with the typical weather pattern for the area. There are 12 different soil orders that are labeled through out the Earth. These soil types are determined by the amount of composition of sand, clay, and silt in the soil. Varying the amounts of each produce different typers of soil. for the visual heuristic involved and in-depth analysis of the soil types, refer to the picture and link below.
Soil Orders:
http://www.nrcs.usda.gov/wps/portal/nrcs/detail/soils/edu/?cid=nrcs142p2_053588
soil triangle